In this Article:
When comparing the .243 and .270 Winchesters, we’re looking at two popular and widely-used cartridges that share some shooting applications.
Despite their similarities, each cartridge has its own strengths and is better suited for different scenarios.
We won’t declare one as superior to the other. Instead, we’ll analyze all the test data and pinpoint the specific situations where each cartridge performs best.
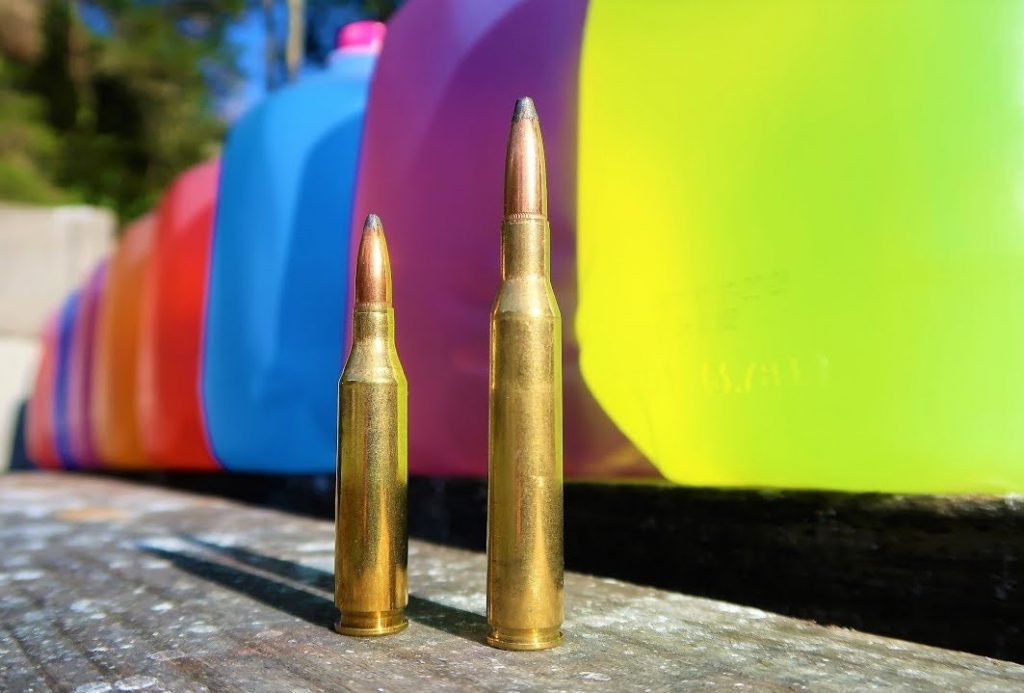
In this article, we’ll examine several popular factory loads for both the .243 and .270 Winchesters. These two well-known cartridges have overlapping shooting applications but also excel in different areas.
And yes, we know and are fully aware that handloading your own brass can impact the ballistic and other performance properties that we will outline below. While we would love to cover other bullet designs, casings, and powders, we just don’t have the room to do so.
BONUS OFFER: Get your free shooting range targets to print at home!
Get your free targets to print at home!
A Brief History
.243 Winchester
The .243 is often called the baby brother of the .308 Win. Introduced in 1955, the .243 Win is a necked-down version of the .308. It provides a long-range hunting round with lighter bullets, making it well-suited for target shooting and varmint hunting.
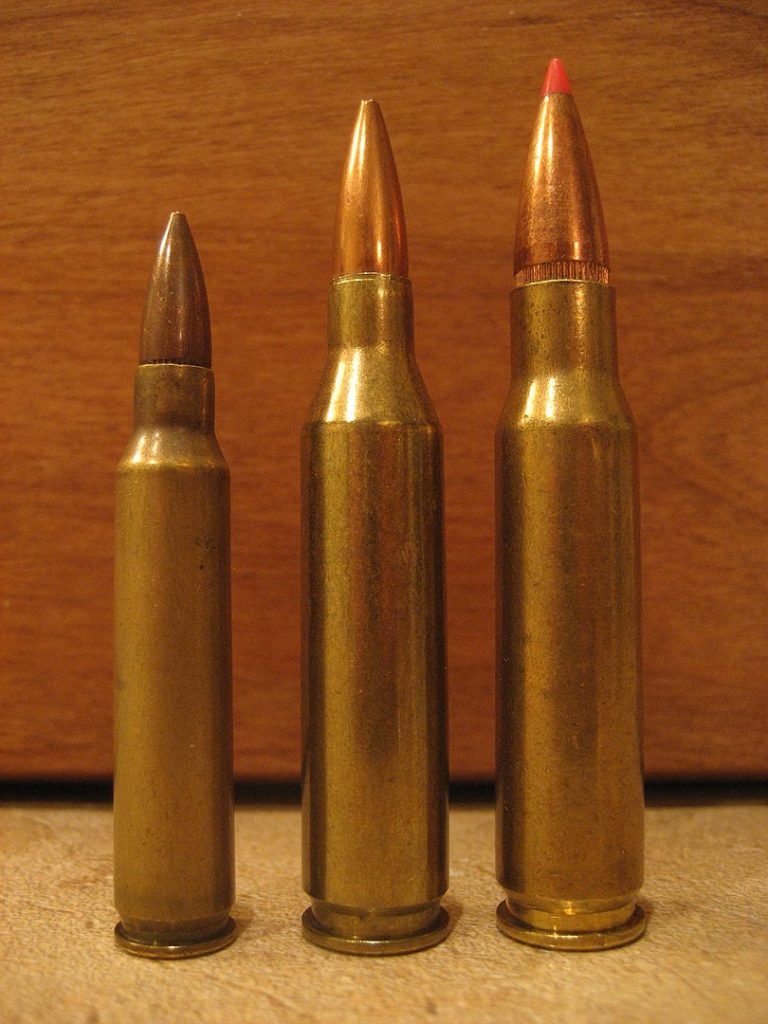
The .243 remains a popular round in the United States, offering hunters a versatile option for various hunting scenarios. It comes in a range of bullet weights from 55 to 115 grains, with most hunting cartridges capping at 100 grains.
The .243 Winchester also has a notable history in long-range shooting, having been a dominant force in matches across the states, even though its prevalence has diminished over time.
.270 Winchester
The .270 Winchester made its debut in 1925 and initially remained relatively unknown.
Developed from the .30-03 casing—a source for many well-known cartridges—this round was among the first to exceed the 3,000fps mark.
Jack O’Connor, a renowned firearm and outdoor writer, advocated for this caliber and highlighted its field performance, helping to elevate it to prominence among hunting cartridges, where it continues to be recognized today.
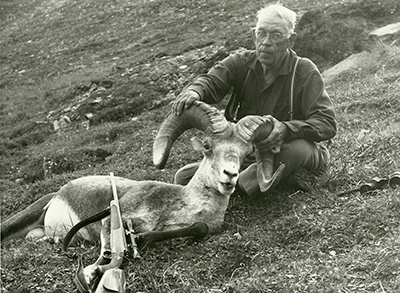
The .270 has garnered a significant following in hunting, proving effective for everything from small varmints and predators to larger American game like sheep and deer.
Advances in bullet technology have made the .270 more suitable for taking down larger game, such as elk, which the .243 is not suited for.
Most .270 ammunition ranges from 120 to 160 grains, though smaller weights are available for small game. Like the .243, the .270 offers a variety of bullet weights and designs, all of which are readily accessible and affordable.
Specs
| .243 Winchester | .270 Winchester | |
|---|---|---|
| Parent Casing | .308 Win | .30-03 |
| Bullet Diameter | 0.243" | 0.277" |
| Neck Diameter | 0.276" | 0.308" |
| Case Length | 2.045" | 2.540" |
| Overall Length | 2.7098" | 3.340" |
| Case Capacity | 53-54.8gr | 67gr |
| Max Pressure (SAAMI) | 60,000psi | 65,000psi |
The cartridge specs for the .243 and .270 reveal some notable differences.
Clearly, the .270 is a larger caliber compared to the .243, with the overall cartridge length of the .270 being just over half an inch longer than that of the .243.
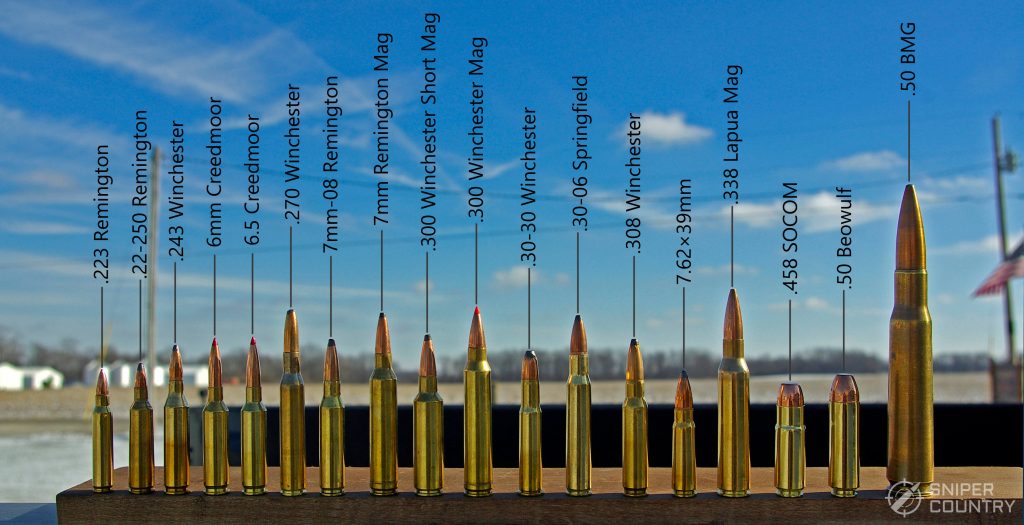
Given these differences, the .270 can accommodate significantly more powder than the .243, which is necessary for propelling heavier bullets at the desired velocities.
We’ll explore how these variations in case design and bullet weights affect the performance of each cartridge in the field.
Below, we’ve listed five popular hunting and target rounds for each cartridge.
While this isn’t a comprehensive list of all available options, these widely-used rounds cover a range of popular grain weights and styles, providing a clear comparison of how the cartridges perform in terms of ballistics and other aspects.
 270 Hornady SST Superperformance 130gr
 270 Winchester Ballistic Silvertip 130gr
 270 Federal Vital-Shok Nosler Partition 150gr
 270 Remington Core-Lokt PSP 115gr
 270 Federal Sierra GameKing BTSP 150gr
 243 Winchester Super-X Power Point 100gr
 243 Hornady Superformance Varmint V-Max 58gr
 243 Remington Core-Lokt PSP 100gr
 243 Federal Vital-Shok Nosler Ballistic Tip 95gr
 243 Nosler Varmageddon FB Tipped 55gr
Popular Articles
But First, This
To clarify a few points—let’s go over some ground rules. The brands and loads selected for this article are not definitive for the .243 vs .270 comparison. If your preferred choice isn’t listed, it doesn’t mean we consider it inferior; these selections are made to keep the list concise while still providing a thorough overview.
For a broader perspective, we’ve included a section at the end of each comparison that examines a wider range of options for each caliber. This will offer a larger data set and more comprehensive averages.
Finally, most of this information is based on computer-generated data, including manufacturer specs and ballistic software.
While this approach is reliable for comparisons, nothing can replace real-world field data, which would be too extensive to cover here. Our analysis combines solid ballistic data with our own experiences with each cartridge.
Recoil
When comparing two cartridges, recoil or “kick” is an inevitable topic of discussion. Although experienced hunters and shooters often prioritize other performance aspects over recoil, it remains an important factor to consider.
Recoil can disrupt a shot, particularly for younger or less experienced shooters who may be preoccupied with the kick as they pull the trigger. This anticipation of recoil often leads to flinching, which is a common cause of missed shots for those early in their shooting and hunting experience.
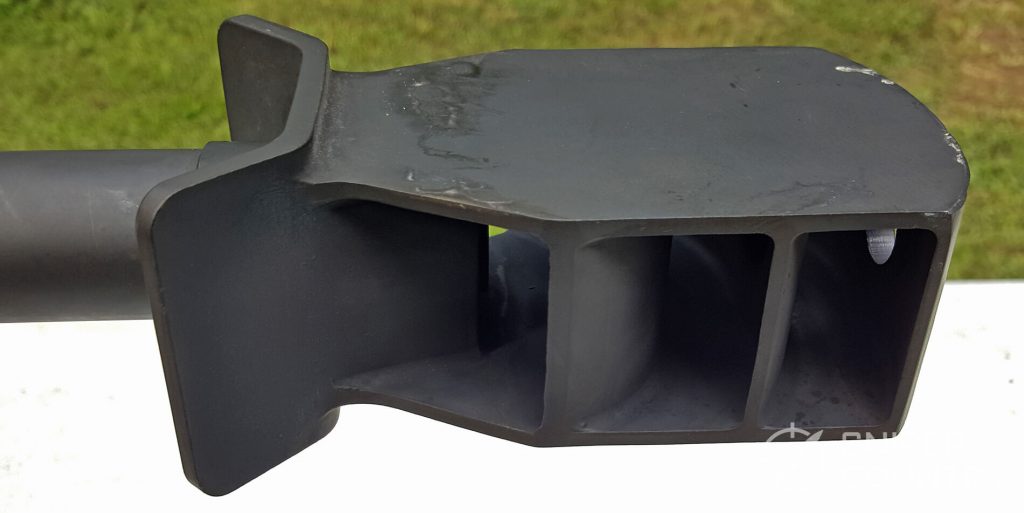
Additionally, significant recoil can slow down follow-up shots, as you need to re-center and re-aim. Even a few pounds of force difference can be crucial in making a successful second shot on a spooked animal.
For these reasons, we’ve examined the recoil produced by these two cartridges. It’s important to clarify that we’ll be focusing on the actual recoil energy (ft.lbs) generated when firing these cartridges, not the “felt recoil” or the perceived kick.
Felt recoil can vary widely based on your shooting technique and the firearm’s characteristics, such as weight and stock design. However, the force generated does impact felt recoil to some extent, particularly when the variables are controlled as we’ve done here.
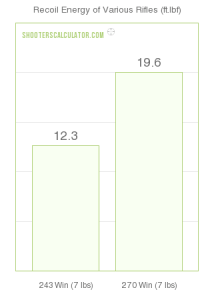
Before diving into our ten selected rounds, let’s first compare these two cartridges using data from a 7lb rifle (Graph 1).
We observe that the .243 Win generates significantly less recoil compared to the .270. However, in the broader context, both cartridges produce considerably less recoil than many other common hunting and long-range competition cartridges.
Generally, it’s noted that a recoil energy of around 20 ft.lbs is sufficient to potentially impact your shot, even for experienced marksmen, especially if they are not well-acquainted with the firearm and cartridge. While this can vary from person to person, it provides a sense of how these two cartridges compare in terms of their potential effect on your shooting accuracy.
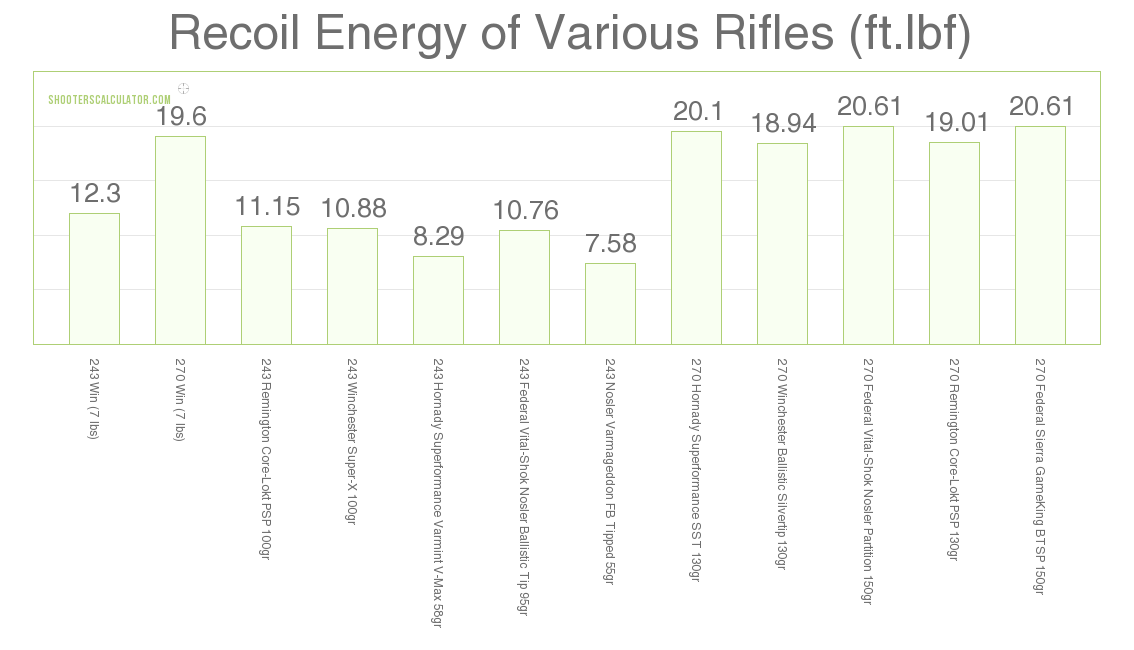
Let’s now focus on a more detailed comparison by examining the recoil energy of the ten rounds we selected for this cartridge comparison (Graph 2).
We’re still using a 7lb firearm and have chosen a standard powder load for each round, based on average bullet weights for each cartridge. While this data can vary with different powder amounts, it provides a reliable comparison since manufacturers typically do not use the maximum powder capacity of the casing.
The graph clearly shows a notable difference in recoil between the two cartridges. The .270 Win rounds consistently produce recoil energy over 17 ft.lbs, whereas no .243 Win rounds exceed 12 ft.lbs. Given the cartridge specs discussed earlier, this difference is expected, as more powder and heavier bullets generally result in increased recoil.
We see a clear distinction in recoil energy between these cartridges. Now, let’s examine the average recoil when considering a broader range of rounds.
Average Recoil (ft.lb)
| .243 Winchester | .270 Winchester |
|---|---|
| 11.25 | 19.56 |
As with the smaller data set, the .270 Win rounds consistently generate significantly more recoil energy than the .243 Win rounds on average. With an average recoil energy of over 8 ft.lbs, the difference between these two cartridges is noticeable. This disparity is evident across all rounds tested, not just a few outliers.
While the .270 Win does produce recoil just under 20 ft.lbs, the difference in recoil between the two cartridges is significant enough to be felt.
For most shooters, both cartridges are manageable, but this may not hold true for everyone. The .243 Win’s lower recoil could make shooting more comfortable for some, though the degree of ease will vary from person to person.
Ballistics
Any serious marksman or shooter is acutely aware of how their chosen cartridge performs once it exits the barrel. Key factors like velocity, ballistic coefficient, and trajectory significantly influence accuracy and effectiveness in bringing down game.
By examining these aspects, we can start to identify the scenarios where each of these cartridges excels and determine their suitability for various hunting or shooting situations.
Velocity
Whether you’re hunting, engaging in distance shooting, or doing a bit of both, velocity is a crucial factor in a bullet’s performance.
Higher velocity typically results in greater penetration and expansion, which are essential for effective hunting.
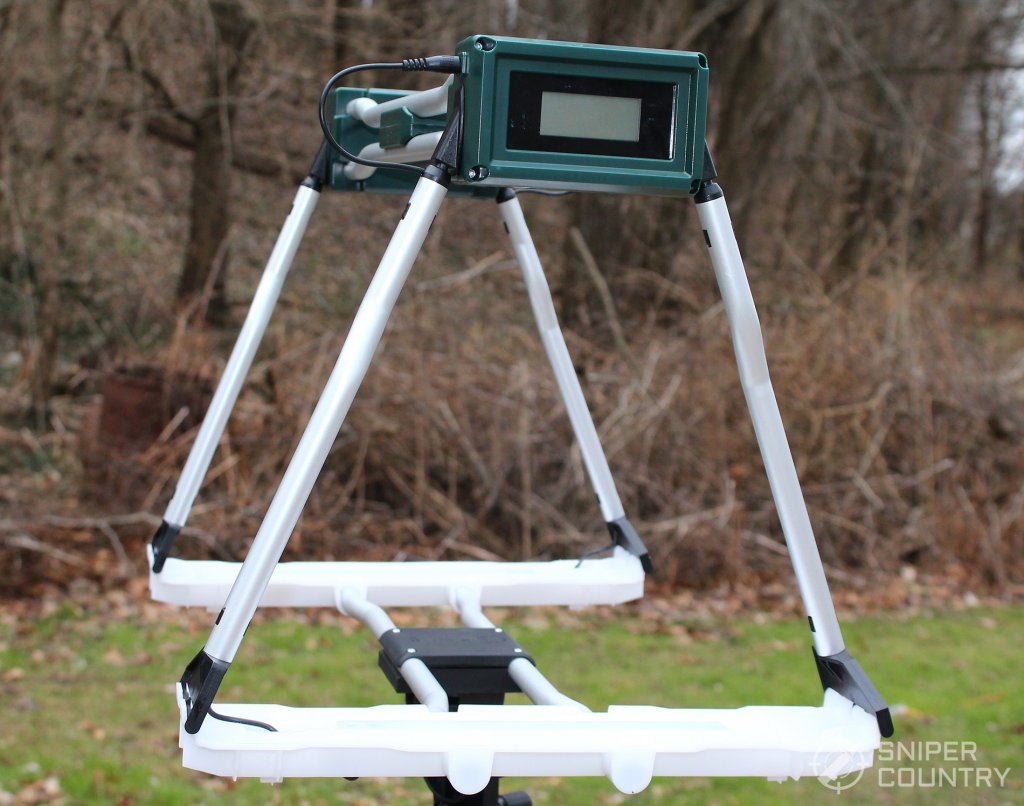
Higher velocity, combined with the right barrel twist rate, helps bullets resist environmental factors, making long-range shooting in windy conditions more manageable. However, many shooters can become overly focused on maximizing velocity.
There is a delicate balance between a high-velocity load that enhances terminal performance and one that risks safety or bullet instability. With factory loads, this is rarely a problem, but when handloading, adding excessive velocity isn’t always advantageous.
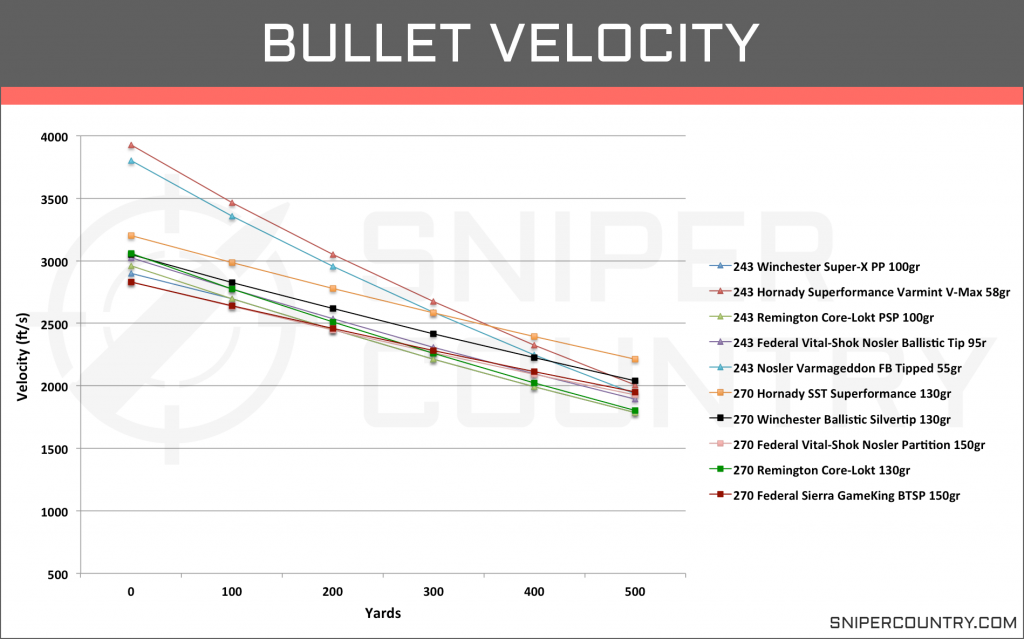
Let’s examine the velocities (ft/s) of our ten selected rounds and see how they compare. Data was gathered from manufacturer websites and tested from a 24″ barrel where specified (Graph 3).
Examining these rounds, it’s clear that muzzle velocities vary significantly. Many of the .243 rounds, especially those with lighter bullets (55 and 58 grains), reach velocities close to 4,000 ft/s.
While impressive, these rounds lose speed quickly due to their light weight and low ballistic coefficient, which we’ll discuss in more detail soon.
In contrast, the heavier .243 rounds (95+ grains) show more consistency from the muzzle to 500 yards and align more closely with the .270 Win rounds.
The rounds that cluster towards the center of the graph indicate considerable overlap between the cartridges.
Overall, the .270 Win shows a slight edge in velocity when excluding the sub-60 grain .243 Win rounds. Both cartridges maintain supersonic speeds through the 500-yard mark, with velocities hovering around 2,000 ft/s.
We’ll explore the limits of supersonic flight for these cartridges in more detail shortly.
Average Velocity (ft/s)
| Yards | .270 Win | .243 Win |
|---|---|---|
| Muzzle | 2963.3 | 3198.7 |
| 100 | 2731.45 | 2897.19 |
| 200 | 2517.8 | 2626.3 |
| 300 | 2309.85 | 2355 |
| 400 | 2114.6 | 2061.7 |
| 500 | 1930 | 1891.9 |
We should also briefly consider the lighter .243 Win rounds, which fall below the 60-grain mark. These rounds significantly impact the average velocities, giving the .243 Win an apparent advantage.
Despite their influence, we include them for a comprehensive comparison of the .243 cartridges.
With the lighter rounds, the .243 Win shows a velocity increase of 100 to over 200 fps compared to the .270 Win through the first 300 yards. However, similar to our earlier data, the .243 loses velocity more rapidly, with the .270 Win surpassing it in velocity at 400 and 500 yards.
Excluding the lighter rounds, the .243 Win still demonstrates a higher velocity than the .270 Win from the muzzle to 300 yards, though the difference is less pronounced. At the muzzle, the .243 Win averages 3,073 fps—just over 100 fps more than the .270 Win.
By 300 yards, the average velocity for the .243 Win drops to 2,307 fps, aligning closely with the .270 Win. At 500 yards, the .243 Win averages 1,878 fps, with the lighter rounds impacting the earlier measurements more.
When comparing individual rounds, excluding the lighter .243 loads, the velocity differences between the cartridges show considerable overlap. The trends are more dependent on the specific round than the cartridge type.
We have also calculated the supersonic flight limits for each round and averaged them for each cartridge.
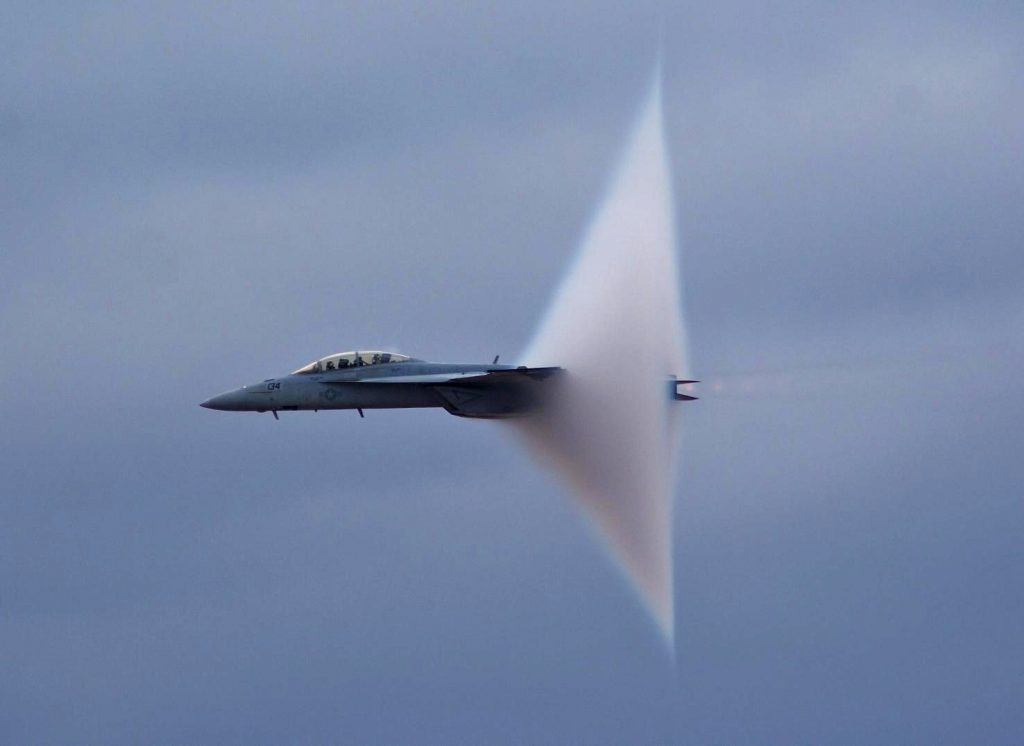
For those engaged in extreme range shooting, the distance a round can maintain supersonic flight is a critical factor. Supersonic speeds ensure that a bullet’s trajectory is more stable and predictable compared to subsonic speeds.
This stability simplifies the process of calculating shots at distances of 700 yards or more, although such long-range shooting remains challenging for many.
Average Supersonic Limit (Yards)
| .243 Win | .270 Win |
|---|---|
| 957.5 | 1101.25 |
Examining the supersonic limits reveals that the .270 Win has a slightly greater average range than the .243 Win, with a difference of just under 150 yards.
Whether this difference is significant enough to influence your decision depends on your specific needs. Individual rounds from each cartridge can vary widely in their supersonic range.
Some .243 rounds do reach beyond the 1,000-yard mark, but the .270 rounds generally cover a broader range, with several extending beyond 1,300 yards of supersonic flight.
Despite the fact that most .243 Win rounds drop below supersonic speeds before 1,000 yards, factory loads typically only offer performance within this range.
For those aiming for precise accuracy at 1,000 yards or more, factory loads may not suffice, and handloading might be necessary.
Both cartridges may fall short of ideal performance at extreme ranges, but with dedicated practice and the right ammunition, both can still be effective.
BONUS OFFER: Get your free shooting range targets to print at home!
Get your free targets to print at home!
Ballistic Coefficient
When comparing or researching cartridges, the term ballistic coefficient (BC) will often arise.
While some shooters may be unfamiliar with it, others consider it crucial when selecting a round.
Simply put, the ballistic coefficient is a calculated value derived from various bullet and cartridge factors. It reflects how streamlined a bullet is, impacting its flight stability and efficiency.
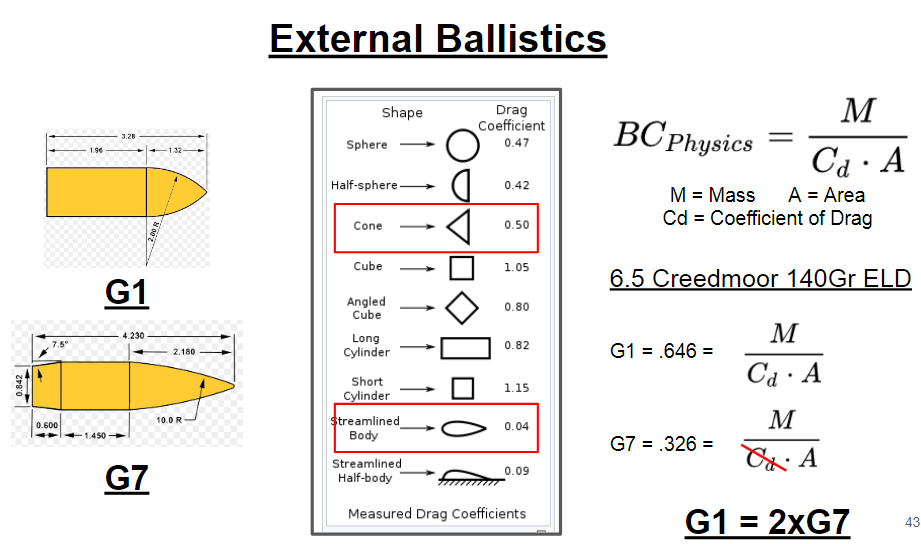
The ballistic coefficient (BC) indicates how well a bullet can resist wind drag and drift, affecting its flight accuracy. A higher BC means better resistance to these factors, which generally translates to improved precision, especially in long-range shooting.
While long-range shooters often emphasize BC, hunters should also consider it. In scenarios like a 300-yard shot with a 10mph crosswind, even a small reduction in bullet drift can be significant. Understanding how cartridges compare in terms of BC can help in choosing the right round for your needs.
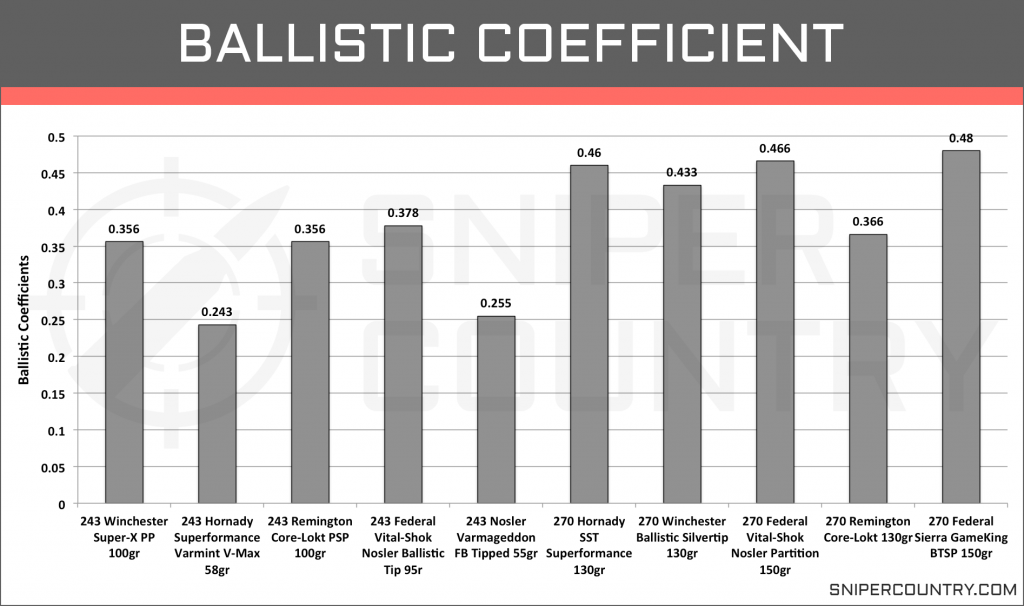
To illustrate this, we’ve compiled and compared the BCs of our selected rounds. The data is presented in graph form to provide a clear picture of how these cartridges measure up against each other (Graph 4).
From the graph, it’s evident that the .270 rounds generally exhibit higher ballistic coefficients (BCs) compared to the .243 rounds.
On average, .270 rounds have a BC of around 0.4, while .243 rounds average around 0.3. A difference of 0.1 in BC can be quite significant in ballistic terms.
This trend is logical given the nature of the bullets. Lighter bullets, typically found in the .243, have lower BCs and are more affected by wind and drift. However, their higher velocities can still enhance their trajectory performance relative to heavier bullets. Despite this, lighter bullets might not always be optimal depending on conditions and range.
It’s important to note that individual rounds can vary significantly, and some .243 rounds may have BCs comparable to or better than some .270 rounds.
For a more accurate assessment of BC differences, reviewing a broader range of samples and excluding lighter .243 rounds can provide a clearer picture.
You might wonder why lighter bullets would ever be used, but increased velocities and being a little less vulnerable to gravity greatly improve their ballistic performance at least from a trajectory standpoint, when compared to heavier bullets and evens the playing field.
Of course, even with lighter bullet weights, they still might not be the best choice depending on environmental conditions and range.
And we are talking about a broad comparison of cartridge to cartridge. Just from our selections, you can see that there are some .243 rounds with BCs that stack up a lot better to the .270 rounds.
When it comes down to picking a round for use, you’re looking at an individual round rather than a broad cartridge family.
To be more secure in saying that the .270 Win rounds are going have higher BCs, we really need to look at more samples which we have done below and also see how the rounds compare when we are not including the sub 60grain .243 rounds.
Average Ballistic Coefficient
| .270 Winchester | .243 Winchester |
|---|---|
| 0.438 | 0.343 |
Even with a larger sample size, the .270 Win consistently shows a notable advantage in ballistic coefficient (BC) over the .243.
When focusing on .243 rounds heavier than 60 grains, their average BC rises to about 0.36, which is an improvement but still falls short compared to the .270 Win’s average BC of around 0.4.
This suggests that while heavier .243 rounds offer better BCs, the .270 rounds generally maintain a superior performance in resisting wind drift and maintaining accuracy.
Trajectory
Trajectory is a crucial aspect of ballistic performance, especially when comparing cartridges like the .243 and .270.
Discussions about how flat a cartridge shoots can often become heated, particularly when they involve hand-loaded rounds or anecdotal evidence rather than concrete data.
In this section, we’ll focus solely on factory-loaded ammunition for each cartridge, using data from manufacturers and tested with 24-inch barrels where available.
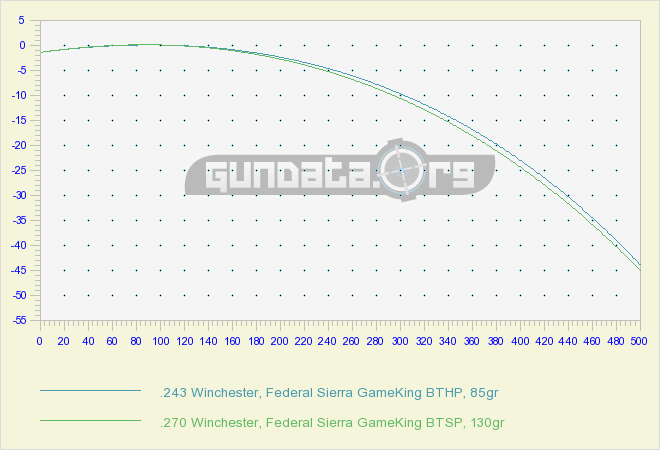
To give a clearer picture before examining the specific rounds, we’ll first present a general overview of the trajectories for both cartridges (Graph 5).
We utilized an online trajectory calculator to generate the trajectory paths for each cartridge, selecting one round from each—the .243 and .270—both from the same manufacturer and with identical bullet designs.
The results indicate that the overall trajectories of these rounds are quite similar. While the .243 shows a slightly flatter trajectory, the difference is minimal, only a few inches. For factory loads, neither cartridge exhibits a drastic drop at 500 yards.
However, this comparison is based on just two rounds. To provide a more comprehensive analysis, we will examine a broader selection of our ten rounds to see how they compare in terms of trajectory.
Short Range Trajectory
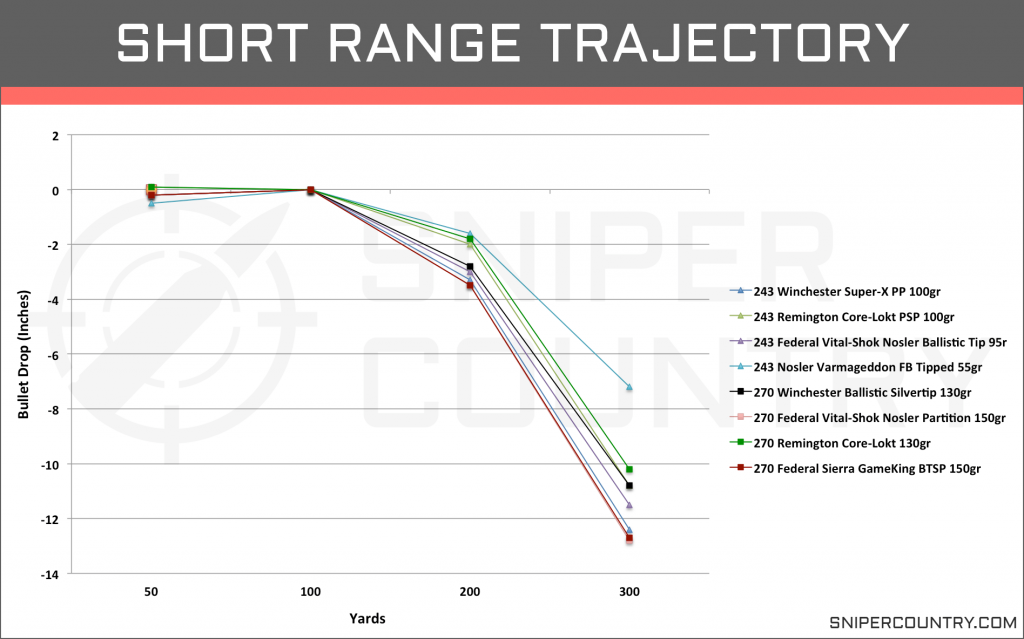
We will first look at the short range trajectory (Graph 6).
We measured bullet drop (in inches) from the muzzle out to 300 yards with the test firearms zeroed at 100 yards.
For hunting, this information is crucial as most field shots are within 300 yards.
The .243 demonstrates notably flat trajectories, especially with lighter grain bullets. These often show only a couple of inches of drop out to 200 yards and about 6-10 inches at 300 yards.
While both cartridges exhibit relatively flat shooting, particularly for factory loads, the .243’s lightweight rounds excel in short-range trajectory, grouping closely together with minimal drop.
However, it’s crucial to consider various performance specs beyond just trajectory. Despite the flatter trajectories of lighter .243 rounds, their lower ballistic coefficients make them more prone to wind deflection.
Additionally, factors like stopping power are essential when choosing a cartridge. We will now examine the short-range trajectory of these cartridges with a broader selection of rounds.
Average Bullet Drop (Inches) at Short Range
| Yards | .243 Win | .270 Win |
|---|---|---|
| 50 | -0.235 | -0.175 |
| 100 | 0 | 0 |
| 200 | -2.62 | -3.14 |
| 300 | -11.19 | -11.91 |
| 400 | -24.78 | -27.38 |
With a larger sample size, the .243 Win continues to show a slight advantage over the .270 Win in terms of bullet drop. This edge is minimal, with less than an inch difference at 50, 200, and 300 yards. At 400 yards, the gap increases to just over two inches.
When excluding the three lightweight .243 Win rounds, which significantly differ from the other rounds in performance, the difference between the .243 and .270 cartridges narrows considerably. Without these outliers, the .243 Win’s average bullet drop at 200 yards is about 2.8 inches, and at 400 yards, it increases to 26.1 inches.
While the .243 Win still exhibits a slightly flatter trajectory on average, both cartridges offer flat-shooting options depending on the specific round chosen.
Long Range Trajectory
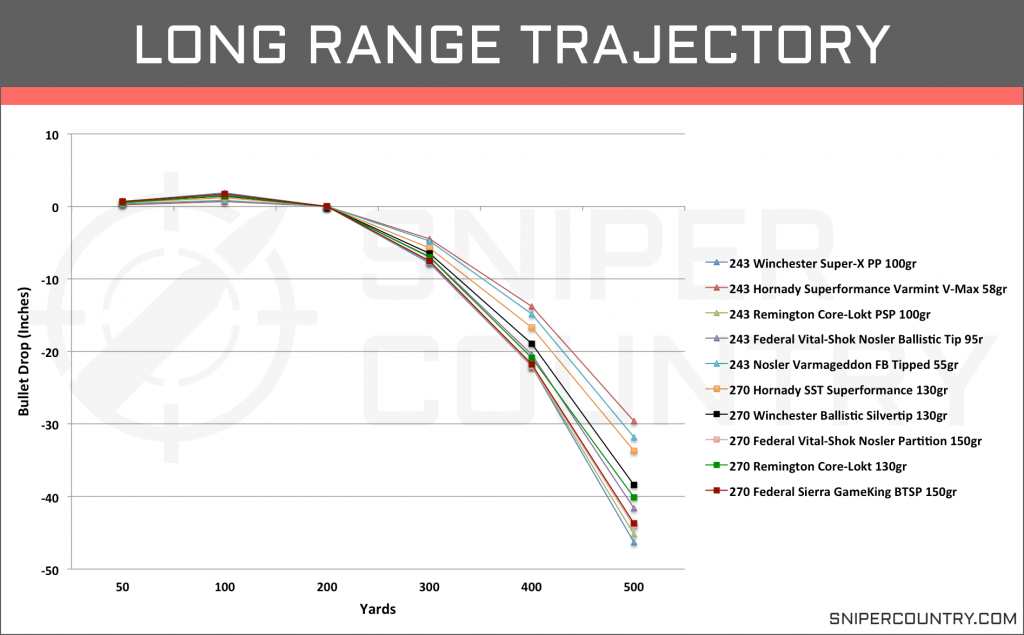
For long-range trajectory (Graph 7), we are using the same units of measurement to analyze the bullet drop from 50 yards to 500 yards, with the test rifles zeroed at 200 yards.
For those looking to drive nails at long distances on the range or hunters who typically find themselves in wide-open spaces where longer shots are needed, this trajectory might be more relevant to your situation.
Like the short range trajectory, we see the flattest arcs with the light grain .243 bullets. Just a note for those who might not be as versed in the shooting sports, while these lightweight bullets might have a flat trajectory, they are going to be lacking in the knockout power department.
Of course, if you’re shooting targets, it doesn’t matter. For the rest of the yardage marks, we are going to exclude those two rounds; they are flat, we get it.
Back on point.
At 300 yards, all of the rounds are tightly clustered around the 6-7″ range, not bad for factory loads. As you move out to the 400-yard mark, you will begin to see some distance forming between the rounds.
There is a tight cluster of the heavier .243 rounds and the heavier .270 rounds around the 22-23″ mark at this range. There are two 130gr .270 rounds with a less pronounced drop, and by that, we only mean a couple of inches, but a couple of inches at 400 yards is pretty significant.
At 500 yards, most of the rounds cluster around the 40-45″ mark except for the Hornady Superformance 130gr bullet.
In general, there is not a huge difference in trajectory when strictly looking at the two different cartridges. From the .243 and the .270, there are rounds that can provide the distance that you need.
For hunters, it all depends on how much power they have once they get there. For target shooters, you will also want to take the ballistic coefficients into the equation.
Before we move on to stopping power, let’s take a look at the long range trajectory of these two cartridges with the larger sample size to generate numbers from. We have also extended the range out to a 700 and a 1,000-yard marker for those who like to test the limits of shooting factory loads.
Average Bullet Drop (Inches) at Long Range
| Yards | .270 Win | .243 Win |
|---|---|---|
| 100 | 1.6 | 1.43 |
| 200 | 0 | 0 |
| 300 | -7.21 | -6.4 |
| 400 | -21.4 | -19.3 |
| 500 | -42.7 | -39.86 |
| 700 | -111.3 | -116.7 |
| 1000 | -347 | -353 |
If we take a second to look at the averages for these two cartridges, we see a really interesting result.
While the .243 Win rounds maintain a flatter trajectory, on average, then the .270 Win rounds through 500 yards, we see the trend flip at the 700 and 1,000-yard mark where the .270 Win has a flatter trajectory at 5.4 inches less bullet drop at 700 yards and 6 inches less bullet drop at 1,000 yards.
If we look at the .243 Win average when excluding the lightweight rounds, we see an average bullet drop of 6.7 inches at 300 yards, 20.2 inches at 400 yards, 41.4 inches at 500 yards, 120 inches at 700 yards, and 357 inches at 1000 yards.
So, with those flat-shooting rounds removed, we see a couple more inches of bullet drop added to the average.
It is interesting that we see the bullet drop increase more significantly for the .243 Win rounds as they move out to further distances. This is the same type of trend that we saw when looking at the velocity of these two cartridges as well.
Stopping Power
Stopping power, while less critical for those who primarily engage in target shooting, is essential for hunters for several key reasons.
Firstly, there are ethical concerns. The fear of wounding an animal and not ensuring a quick, humane kill is a significant issue for hunters. Secondly, safety is a major factor; encountering a wounded animal that still poses a threat can be extremely dangerous. Lastly, no hunter wants to spend hours tracking an injured animal over long distances after a poorly placed shot.

It’s important to note that “stopping power” isn’t a concrete metric that you can use to directly compare one cartridge to another. Rather, it’s a broad term that refers to how effectively a cartridge performs upon impacting a living target. This encompasses several factors and aims to give you a clearer idea of what works best for different scenarios.
Factors influencing a cartridge’s stopping power include the bullet’s kinetic energy, its ability to penetrate, and the size of the wound it creates. Additionally, your skill in placing the shot accurately plays a crucial role; without precision, the numbers alone won’t determine effectiveness. This section will focus on kinetic energy, sectional density, and bullet momentum.
BONUS OFFER: Get your free shooting range targets to print at home!
Get your free targets to print at home!
Energy
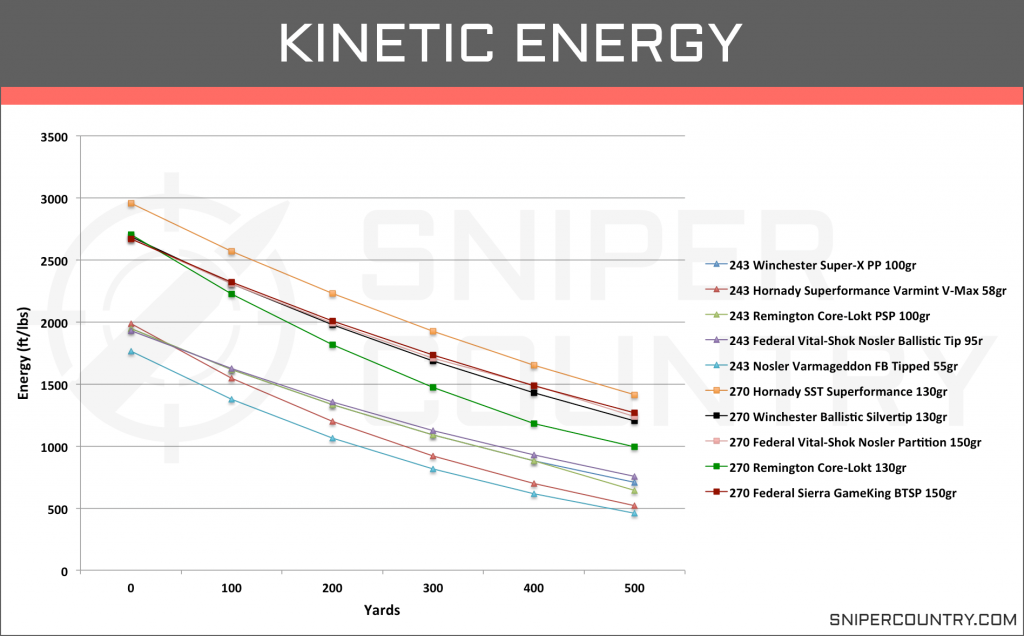
When the powder ignites and propels the bullet, it carries kinetic energy that is transferred to the target upon impact. The amount of force the bullet carries is determined by both its mass and acceleration. Although the energy carried by the bullet is just one aspect of stopping power, it remains a crucial element. We collected energy data from the manufacturers’ websites for the selected rounds and have compiled it into the following graph (Graph 8).
We are looking at the force (ft.lbs) from the muzzle to 500 yards downrange.
Unlike most of the ballistic properties we have looked at so far, there is a general distinction in stopping power between the .243 and .270 cartridge. Right out of the muzzle, the .270 rounds have nearly 1,000 extra ft.lbs of force on the .243 round.
This trend continues out to the 500-yard mark where all of the .243 rounds have well below 1,000ft.lb of force associated with them while the .270 rounds vary between 1,000 to nearly 1,500ft.lb of force.
This will obviously be a huge factor in the type of hunting these rounds are suitable for, and we will get back to shortly.
Let’s take a look at the average kinetic energy carried by each cartridge when expanding the field of available rounds.
Average Bullet Kinetic Energy (ft.lbs)
| Yards | .243 Win | .270 Win |
|---|---|---|
| 0 | 1936.6 | 2676.4 |
| 100 | 1595.45 | 2276.6 |
| 200 | 1302.7 | 1932.65 |
| 300 | 1062.3 | 1623.88 |
| 400 | 858.25 | 1372.45 |
| 500 | 692.15 | 1117.6 |
With more rounds, we still see that the .270 Win is carrying a great deal more energy than the .243 Win rounds. Given the kinetic energy is generated from the velocity of the rounds as well as the mass of the projectiles, it is not a surprise that the .270 Win outperforms the .243 Win in this case.
And given that, it’s quite possible that the lightweight .243 Win rounds are skewing this data. When they are excluded, we see an average KE of 1945ft.lbs at the muzzle, 1095ft.lbs at 300 yards, and 727ft.lbs at 500 yards.
The change is not too drastic at the earlier yard markers because the velocity of these rounds are so high and velocity is actually squared in the equation for KE. As these rounds lose velocity downrange, you can see that they really start to drag down the KE average for the .243 Win.
Overall, we are pretty confident in these numbers and they give you an accurate description of how these two cartridges compare in terms of kinetic energy.
Penetration (Sectional Density)
Similar to the kinetic energy of a bullet, penetration is a crucial aspect of a round’s stopping power. Several factors influence how deeply a bullet will penetrate, including its velocity and design. Bullets that do not expand will penetrate more deeply but may cause less damage to the surrounding tissue.
On the other hand, bullets that expand rapidly create larger wounds but might not penetrate deeply enough to reach the vital organs of larger game.
Achieving the right balance is essential: the bullet must penetrate sufficiently to hit vital organs while also expanding enough to inflict significant damage to the surrounding tissue.

As we delve into the potential penetration of these rounds, it’s crucial to consider several factors, including sectional density (SD). Sectional density is calculated based on the bullet’s weight and diameter and provides insight into how effectively a bullet can penetrate a target.
To illustrate, if you compare two bullets of equal weight but differing diameters, the bullet with the smaller diameter will concentrate its force over a smaller area, leading to deeper penetration. This makes SD a useful metric for understanding how different bullets might perform in terms of penetration.
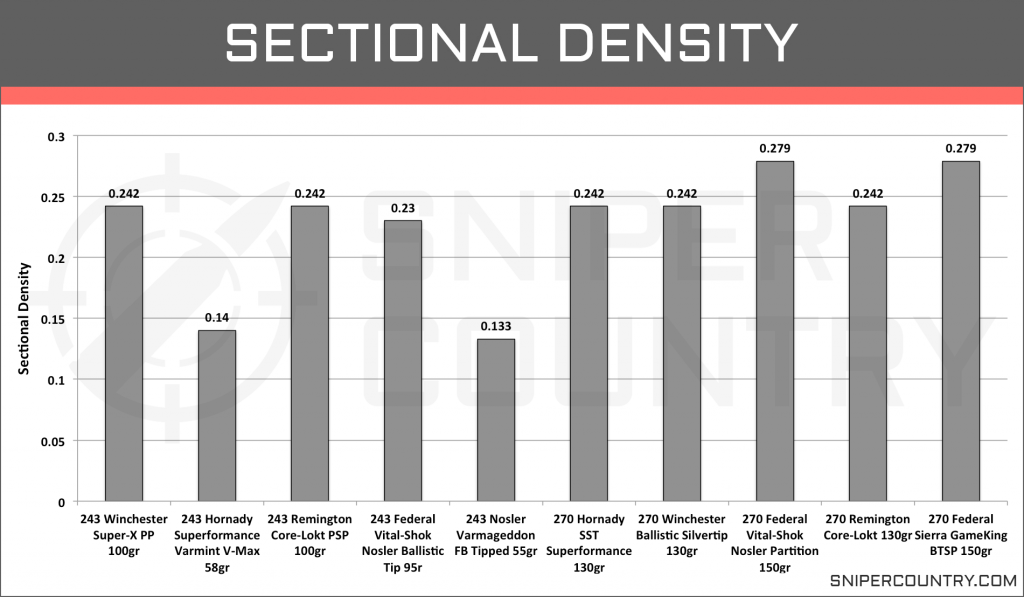
We’ve computed the sectional densities for the ten rounds discussed in this article and presented them in graph form (Graph 9). This should help provide a clearer picture of how each round stacks up in terms of its penetration potential.
On average, the .270 looks to have a higher sectional density than the .243 rounds, though their average is dropped significantly due to the lightweight 55 and 58gr rounds.
The heavier (150gr) .270 rounds have a significantly higher sectional density than the .243 rounds. With the smaller diameter of the .243 rounds, even the 95 and 100gr bullets have a similar sectional density to the heavier 130gr .270 rounds.
If you know you’re going to need more penetration for hunting something like muleys, and are for whatever reason stuck between choosing between these two rounds, the heavier .270 rounds are going to be a better option.
For anything smaller than that, both the .243 and .270 have plenty of options. And like we have stated previously, penetration is just part of the overall equation to picking a formidable round with plenty of stopping power.
Let’s take a look at the sectional density numbers generated from our expanded round list.
Average Sectional Density
| .270 Winchester | .243 Win |
|---|---|
| 0.269 | 0.209 |
Like previously, the .270 Win rounds have a higher sectional density average than the .243 Win round. These two rounds are not to far about when it comes to bullet diameters, but the .270 Win rounds have a higher mass which is going to bump up their sectional density.
Given the bullet’s weight is half of the equation for sectional density, we have to factor in how the sub-60grain .243 Win rounds are affecting these numbers.
When excluding those rounds, we see an average .243 Win sectional density of 0.222 which is a pretty significant jump in relation to sectional density.
Even when not considering the lighter rounds, there is not any overlap between the individual rounds of these two cartridges. While it’s not a complete list, you are going to see higher SDs associated with .270 Win rounds in comparison to .243 Win rounds the vast majority of the time.
Penetration (Momentum)
Bullet momentum is the second metric we will use to compare these two cartridges and their potential penetration.
If we remember back to our high school or undergrad physics class, we remember that momentum is the ability for an object in motion to remain in motion.
It’s a little indirect, but the higher the momentum of the bullet, the more resistance it can overcome and keep driving forward.
We can think of this in terms of penetration. For bigger game that might have a thick hide and thick bones, you want a bullet with higher momentum to drive through and allow proper wound creation and a clean pass through. And even that last part has been and is still debated.
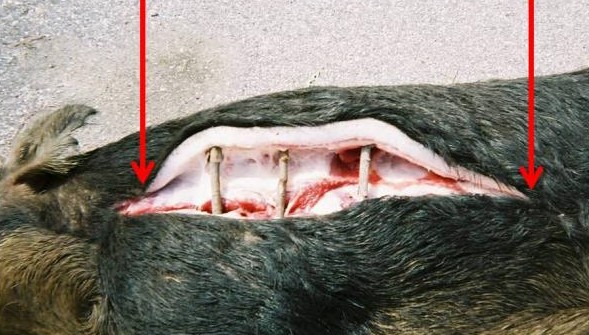
Do you want a clean pass-through, which usually provides better blood trails and conserves meat or do you want full expansion with major damage? We leave that to you, the reader.
We have yet to come across any type of guideline for how much momentum is needed for certain game, so this comparison really is just to show any differences between the two cartridges.
There are plenty of values that can be calculated which integrate momentum with other factors, but none that look at momentum alone.
The actual numbers for centerfire rifles are not as important as you will see with archery because of the properties of bullets. With their speed and shape, these rounds are not going to only penetrate half an inch or bounce off the target.
You’re going to get penetration, but does one cartridge have the higher potential penetration? That is what we are really looking at here.
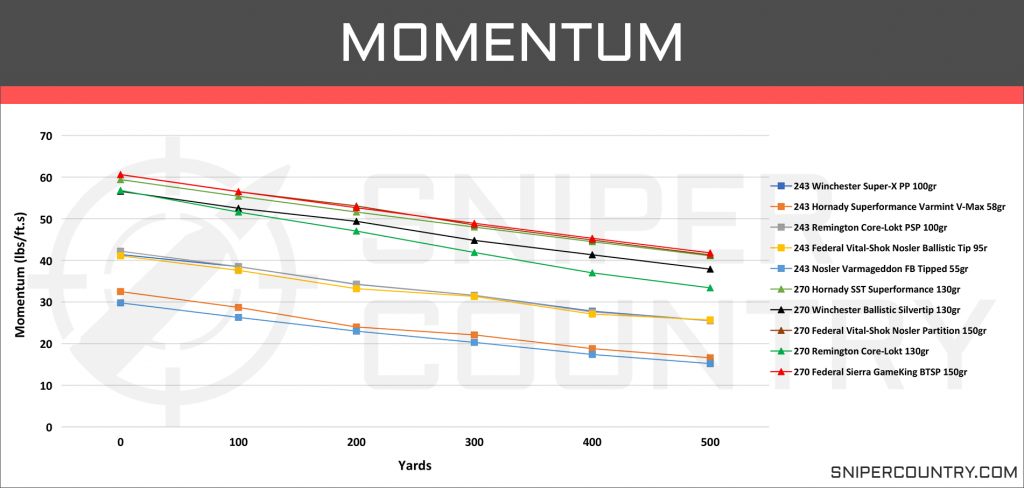
We have calculated the momentum data for each of the selected rounds from the muzzle out to 500 yards and graphed them below (Graph 10).
The patterns we see from this graph are interesting. The first thing that should jump out to you is that the .270 Win rounds are carrying more momentum than the .243 Win rounds.
Even when we remove the two lightweight .243 Win rounds, the .270 rounds are carrying an average of 17lbs/ft.s of momentum at the muzzle and 13lbs/ft.s more at 500 yards.
This is a pretty significant difference and it mirrors the distinct differences between these two cartridges that we observed in kinetic energy carried by these cartridges.
Let’s take a look at the numbers when we include more rounds and see if we still see the same results between these two cartridges.
Average Bullet Momentum (lb/ft.s)
| Yards | .243 Win | .270 Win |
|---|---|---|
| Muzzle | 38.9 | 58 |
| 100 | 35.4 | 53.3 |
| 200 | 31.9 | 49 |
| 300 | 29.6 | 45.5 |
| 400 | 26.3 | 41.5 |
| 500 | 24.5 | 38.6 |
With more rounds added to the analysis, we still see the same trend of the .270 Win carrying more bullet momentum than the .243 Win. It’s not a surprising result given momentum is just the velocity times the mass of the projectile.
We saw similar velocities but generally much heavier rounds for the .270 Win which leads to its advantage in this category.
The averages are pretty similar to the averages from the smaller sample size. And while the lightweight .243 rounds do bring down the average slightly, it’s not really impacting the interpretation of how these two cartridges compare to one another.
With those rounds excluded from the average, the .243 Win has an average momentum of 40lbs/ft.s at the muzzle, 36.7lbs/ft.s at 100 yards, and 25.6lbs/ft.s at 500 yards. So they are bringing down the average roughly 1lb/ft.s from the numbers in the table.
So even when just comparing the average and heavier bullet weights of the .243 Win, we still see a significant increase in bullet momentum with the .270 Win rounds.
Accuracy
Naturally, no cartridge comparison is complete without discussing accuracy. After all, the effectiveness of a cartridge hinges on its ability to hit the target reliably.
Accuracy is ultimately assessed through shot groupings on the range. However, the challenge with measuring accuracy is that it is significantly influenced by factors such as the firearm used, the skill of the shooter, and environmental conditions.
Nevertheless, we can examine the various ballistic characteristics we’ve covered so far to draw some insights about each cartridge’s accuracy.
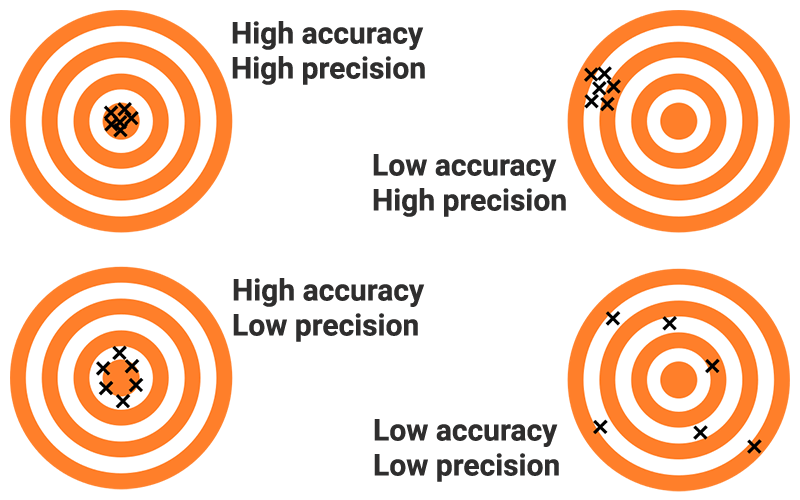
With the rounds chosen for this .243 vs .270 comparison, we’re confident that anyone with some shooting experience should be able to effectively hit targets within 300 yards with either cartridge. However, there are a few considerations regarding ease of use.
From the ballistic coefficients we discussed earlier, it’s evident that .270 rounds generally exhibit better resistance to wind drift and drag compared to the .243 rounds. Despite this, the .243’s velocities are sufficient that its lower BCs don’t significantly impact performance at the typical ranges for these rounds. Overall, the BCs of the .243 are still quite respectable.
When considering more extreme ranges, it’s worth examining the factory loads of these cartridges and their ability to maintain supersonic speeds. The .270 Win typically has about 150 more yards of supersonic flight compared to the .243 Win. In fact, many .270 Win factory loads remain supersonic up to 1,300 yards, while the best .243 Win rounds might only reach up to 1,100 yards.
Both cartridges offer factory loads with supersonic flight capabilities for most practical shooting distances, but neither may meet all the performance criteria needed for accuracy at 1,000 yards. At such distances, bullets are generally more stable, which could simplify adjustments for long-range shots (though I find that doesn’t necessarily make it easier for me).
So, if you’re using factory loads for extreme long-range shooting, the supersonic limit is a critical factor. Broadly speaking, there isn’t a significant accuracy difference between the .243 and .270 for factory loads. However, individual rounds and shooters may experience more noticeable differences, particularly beyond 300 yards.
Price & Availability
Given the current economic climate, both cartridges have seen price increases, but they remain widely available in most local gun stores and online.
The .270 Win typically costs a bit more, though the difference is minimal—usually within 10 to 15 cents per round for quality ammunition.
Unfortunately, neither cartridge offers many plinking options, as they are primarily designed for hunting. Most options start at approximately $1.60 per round.
| Ammunition | Price (20 Rounds) |
|---|---|
| 270 Hornady SST Superperformance 130gr | $24.99 |
| 270 Winchester Ballistic Silvertip 130gr | $31.99 |
| 270 Federal Vital-Shok Nosler Partition 150gr | $37.79 |
| 270 Remington Core-Lokt PSP 115gr | $22.99 |
| 270 Federal Sierra GameKing BTSP 150gr | $30.29 |
| 243 Winchester Super-X Power Point 100gr | $20.49 |
| 243 Hornady Superformance Varmint V-Max 58gr | $23.99 |
| 243 Remington Core-Lokt PSP 100gr | $22.99 |
| 243 Federal Vital-Shok Nosler Ballistic Tip 95gr | $29.79 |
| 243 Nosler Varmageddon FB Tipped 55gr | $36.50 |
Special Offer: Join our private community and get exclusive gun deals, handpicked gear recommendations and updates on law changes, every day!
Join our private community
Applications
The .243 and .270 cartridges overlap in many areas, but at their core, both are tailored for hunting.
For typical hunting distances under 300 yards, either cartridge performs admirably. However, for larger game such as elk or moose, the added power of the .270 Win proves advantageous.

On the flip side, the .243 Win is well-suited for smaller game such as predators, whitetail, sheep, goats, and hogs, offering the benefit of reduced recoil.
For distances beyond 300 yards, which is considered long-range for hunting, the .270 Win excels with less drop, more energy, and a cleaner kill, provided you have the skill for ethical shots.
Neither cartridge is particularly outstanding for long-range precision shooting, as both are primarily designed for hunting and finding match-grade factory ammo is rare. While both can perform accurately beyond 500 yards, achieving consistent success at 1,000 yards or more is challenging.
Best Rounds
Next, we’ll highlight a few rounds from each cartridge that we believe excel in particular shooting niches discussed in this article.
We’re not claiming these are the absolute best, but they are rounds we personally prefer. Choose the round that suits your rifle and confidence level, and stick with it. If you don’t have a go-to round yet, this could be a solid starting point.
Top Hunting Round
Choosing the best hunting round often depends on your specific hunting needs, but we have recommendations for each cartridge discussed.
For the .243, we recommend the Federal Vital-Shok Nosler Ballistic Tip 95gr for deer hunting. It boasts a strong BC and a trajectory that remains flat up to 200 yards, minimizing the need for major adjustments.
With over 1,000 ft.lbs of force up to 300 yards, it delivers sufficient penetration and expansion for vital organ hits and significant tissue damage.
For the .270, the Federal Vital-Shok Nosler Partition 150gr stands out for deer and medium-sized game. This round offers an excellent balance of penetration and expansion, delivering nearly 1,500 ft.lbs of force at 400 yards.
Beyond 300 yards, you’ll need to rely on your optics for adjustments, but this round is versatile enough for shots at 100 yards or less, and even suitable for larger game than deer.
Top Range Round
While neither the .243 nor .270 is top-tier for long-distance shooting, they can still be enjoyable at the range.
For the .243, the Hornady Superformance Varmint V-Max 58gr is an excellent choice. These rounds offer very low recoil, are reasonably priced, and feature a flat trajectory that allows for effective shooting beyond 300 yards.
Conclusion
When comparing cartridges like the .243 and .270, it’s common for people to choose a side in the debate over which is superior.
In truth, each cartridge excels in different shooting scenarios and their performance characteristics might align better with individual experience and preferences. Our aim is not to declare one cartridge as superior but to present data on their ballistic and performance features, helping you choose the one that best fits your needs.
Remember, you’re not restricted to just one cartridge for life. If possible, try both to expand your hunting and shooting experiences.




![9mm Glock Models [Ultimate Guide]](https://www.snipercountry.com/wp-content/uploads/2018/10/Glock-17-vs-Glock-19-vs-Glock-26-vs-Glock-41-vs-Glock-43-WM-400x250.jpg)
![Handgun Caliber Chart [2025 Ultimate Guide]](https://www.snipercountry.com/wp-content/uploads/2018/10/Handgun-Caliber-Comparison-400x250.jpg)
![Rifle Calibers [Ultimate Guide]](https://www.snipercountry.com/wp-content/uploads/2018/12/Header-1900-400x250.jpg)

I really appreciate all this research for these two rifles. Thank you.
Excellent and well-researched article . . . scholarly . . I have two friends who just returned from an African Plains Game hunt with over 50 animals taken . . . the majority with a .243 . . longest shot was over 800 yds
Thanks for the great article. You laid it out the difference between the two cartridges very well.